A representative selection of these tabs is shown below.The Demo download includes more documentation relating to the Eclipse plugin. You can download it here.
| Selecting Code artefacts for analysis | |
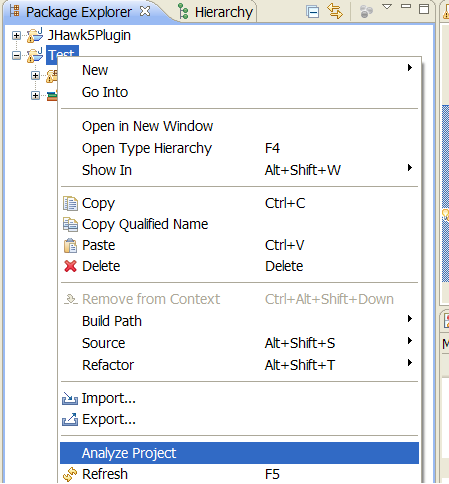 |
Code artefacts can be selected in the explorer view of Eclipse. You can select at Project, Package and Class level and all java code at that level and below will be selected and analyzed by JHawk. It will then be displayed in the JHawk Metrics view. |
| The dashboard tab | |
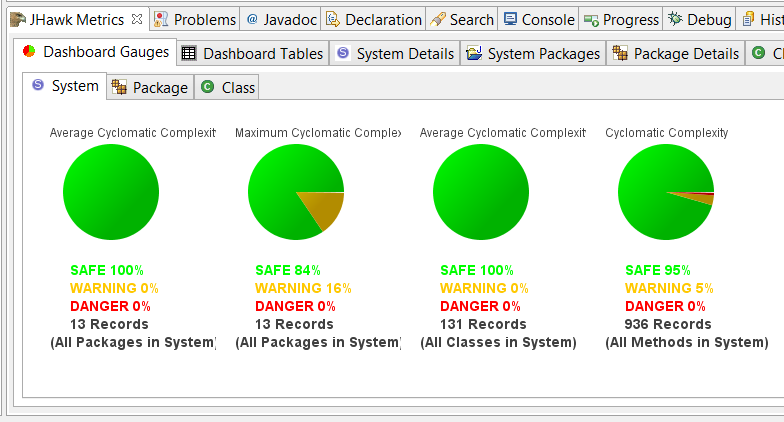 |
The dashboard tab provides you with a visual summary of the state of your code at System, Package and Class level. It does this with a series of pie charts that reflect the proportion of elements (packages, classes, methods) whose metrics have crossed a particular warning or danger level. The default settings will be displayed when you first start the product. You can modify these to provide you with the diagnostic information that you need and you can reset the dashboard back to the default values at any time. |
| The System Details Tab | |
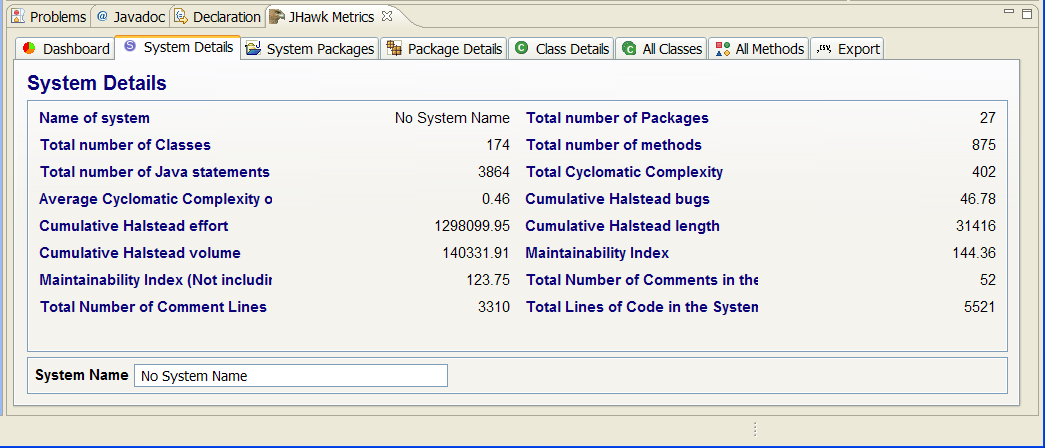 |
The System tab provides the top level figures on your code. It shows you the main system level metrics relating to the code that you have chosen to analyse. |
| The System Packages Tab | |
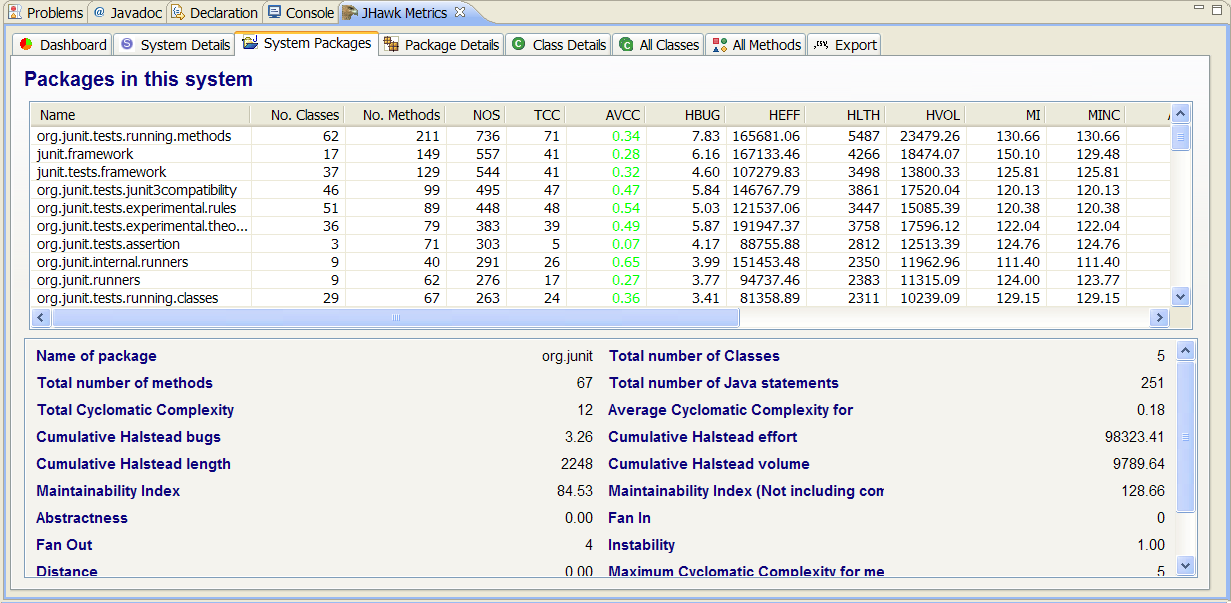 |
This is the first of a series of inter-related tabs that allow you to drill down through your data at System, Package, Class and Method level. These tabs all follow the same pattern the top part of the tab is a list of all the artefacts at that level with the metrics collected summarised in the columns of the table. Clicking on a row in the table will cause the full detail relating to that artefact (in this case a Package) to be displayed in the area below. The selected package will be used to populate the 'Package Details' tab. |
| The All Classes Tab | |
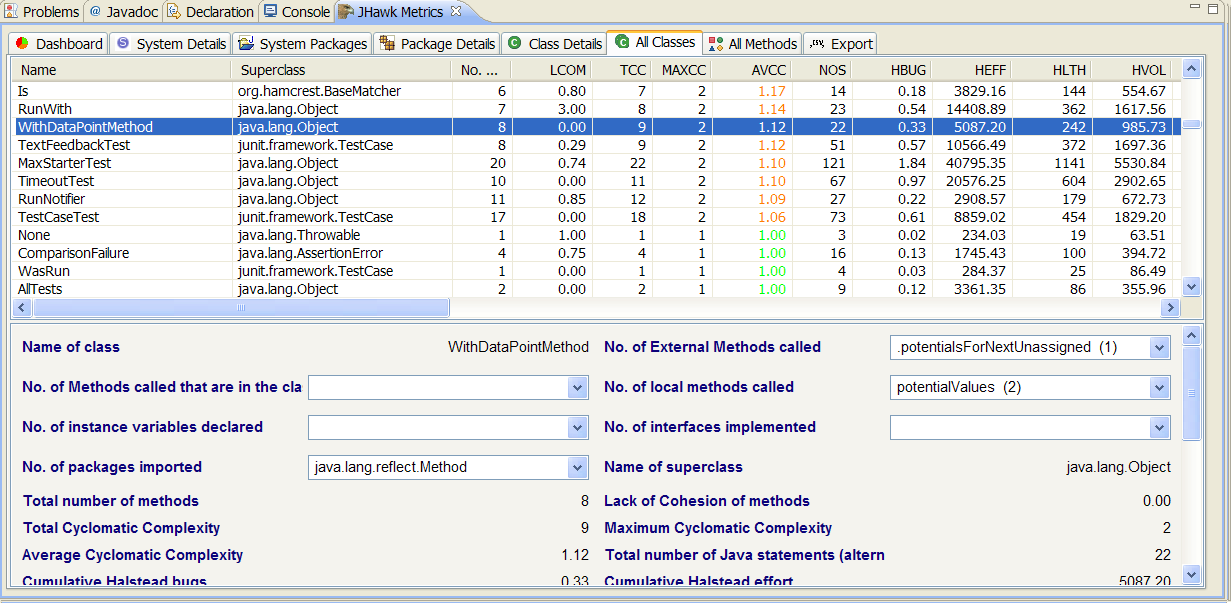 |
The All Classes tab consists of a table showing a list of all the classes in the System with the metrics collected in each column. Only the active metrics are shown.. You can see all the metrics collected for an individual class by clicking on the listing for that class in the table details of the metrics will be displayed in the panel below.
Double clicking on any class in the table will cause the associated source file to be opened in an editor on the Workbench.
|
| The Export Tab | |
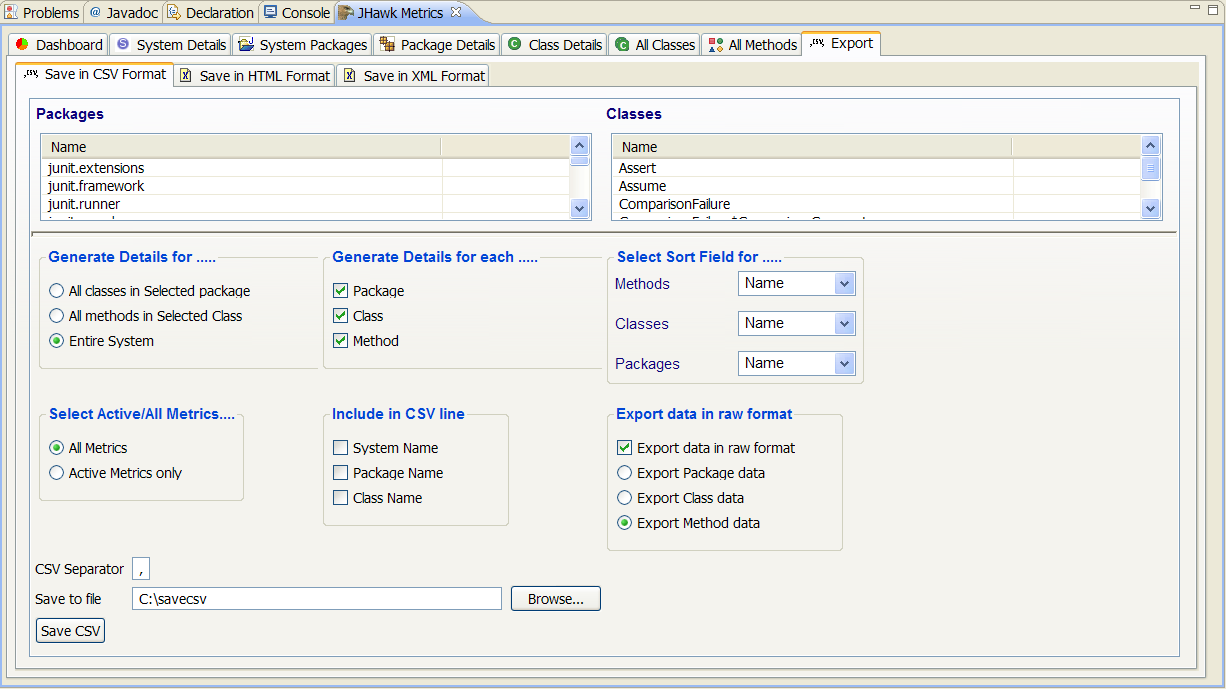 |
The Export tab opens on the Save in CSV format sub-tab, which is used to export data in CSV format. This is the first of three sub-tabs the other two are the Save in HTML format tab (which allows you to export data in HTML format), and the Save in XML format tab (which allows you to export data in XML format, including the interchange format that is used in the JHawk Data Viewer). |
| Preferences | |
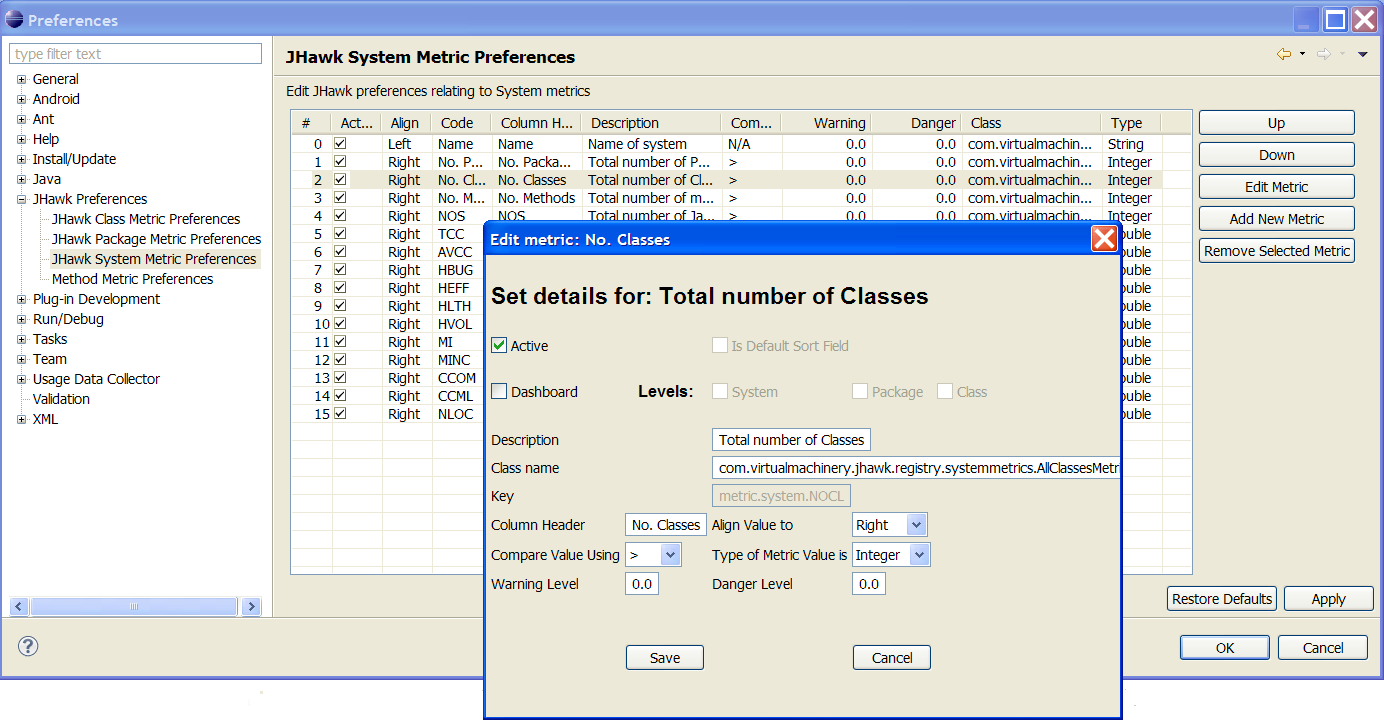 |
The JHawk Preferences are accessed via the Eclipse Window menu then select Preferences, then JHawk Preferences. The dialog tab opens on the General preferences.. The System, Package, Class and Method sub-tabs allow you to configure the metrics available at each of the System, Package, Class and Method levels. At each level the user can modify, add and delete individual metrics as well as controlling the display of metric data in tables and in the dashboard tabs. |
You may be interested in some of our other products. All have demo or trial versions. Just click on the links below to find out more -