  |
| JHawk Application Guide |
| Product Home | Manual | Metrics Guide | DownloadTrial | FAQ, News, Bugs | Other Products |
|
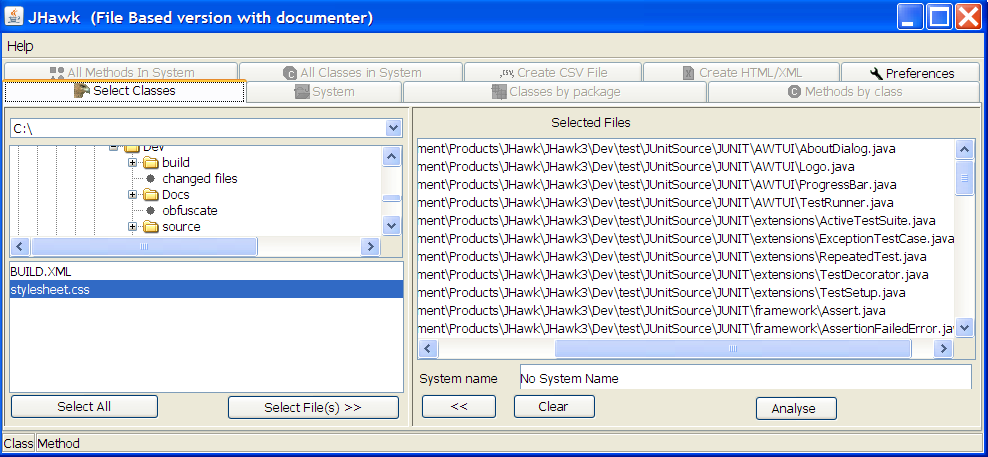
Running JHawk To start the JHawk application run the JHawk jar. You can do this by using the runjar.bat file provided with the initial distribution. This will bring up a window with eight tabs as shown below. Initially the eight tabs will be disabled until you have selected and analysed a group of files. To stop the application at any time click on the 'X' icon in the top right of the window. If you are analysing very large numbers of files then you should read the notes about performance here Your distribution also includes a Command Line version which can be used on its own or with programs like Ant to allow JHawk to become a part of your automated build cycle. You can find out more about the command line version here .
When you have selected the files that you wish to analyze you can analyze them by pressing the 'Analyze' button. As the files are processed their names will appear in the status bar. During this process the 'Analyze' button will be disabled - it will be re-enabled when the processing is complete. If you wish to start again you can use the 'Clear' button to clear the list of files for analysis and all the associated data on all the tabs. Viewing the results When the analysis process is complete the anlayze classes button will be reactivated and you can select how you want to view the results by clicking on one of the other tabs
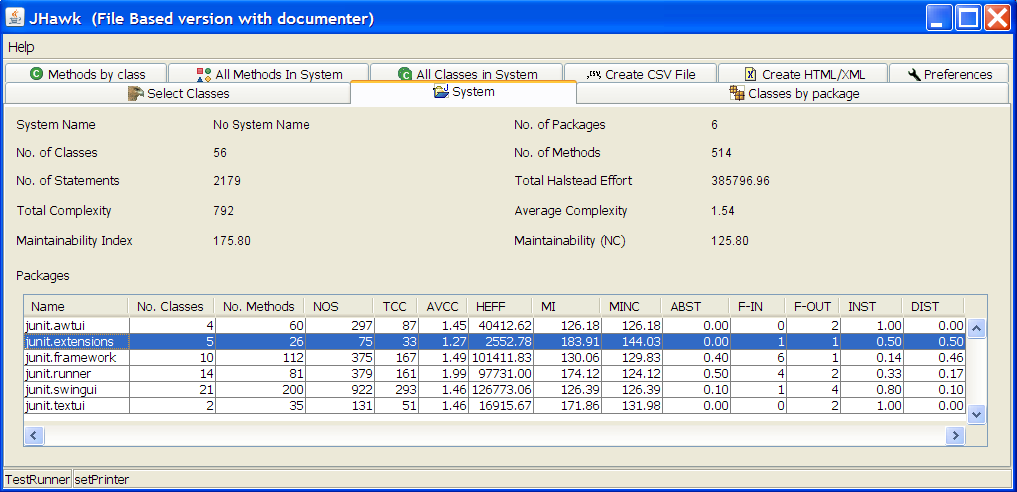
System Overview The upper pane shows data relating to the analysis of the system as a whole. For a detailed analysis of what these figures mean see here. This tab also shows a list of packages in the lower list pane. Allowing the mouse to hover over a column will display information relating to that column. This list can be sorted on any of the columns by double clicking on the column header (see section on sorting below).
Double clicking on a selected row in the list will bring up further information about the package in a dialog.
Classes by Package This tab shows a list of packages in the upper list pane. Selecting one of these packages will cause the data relating to each of the classses in that package that have been chosen for analysis to be summarized in the lower panel. This list can be sorted on any of the columns by double clicking on the column header (see section on sorting below).Allowing the mouse to hover over a column will display information relating to that column.
Further details from the analysis of each of the classes will be displayed if you double click on the line in the table. An example of the data displayed is shown below.
Methods by class This tab shows a list of packages in the upper left list pane an a list of classes in the upper right pane. Selecting one of these packages will cause the classes in that package to be listed in the right hand pane. Selecting one of the classes will display data relating to each of the methods in that class to be summarized in the lower panel. Allowing the mouse to hover over a column will display information relating to that column. This list can be sorted on any of the columns by double clicking on the column header (see section on sorting below).
Further details from the analysis of each of the methods will be displayed if you double click on the line in the table. An example of the data displayed is shown below.
Sorting the data in a table
All Classes in System This tab shows all the classes in the System that have been analysed. Both the sort feature and the ability to show detailed information on the class (by double clicking on its summary line) are available. By clicking the 'Design View' radio button the design view of the metrics will be shown rather than the standard view.
All Methods in System This tab shows all the methods in the System that have been analysed. Both the sort feature and the ability to show detailed information on the method (by double clicking on its summary line) are available.
Saving data in CSV format This tab allows you to save out your data in CSV format. You can select all or part of the system and choose which types of data are output. For each type (Package, Class, Method) an overview line will be output. You can then import the CSV file into the spreadsheet of your choice. In general these spreadsheet files will be easier to manipulate if you just choose one level of reporting (Package, Class or Method). Choosing multiple levels will cause the summary results from each level to be interspersed through the results and make sorting and totalling difficult.
Saving data in HTML/XML format This tab allows you to save out your data in HTML or XML format. You can select all or part of the system and choose which types of data are output. If you save to HTML format a main page will be created for the system depending on the categories selected (Package, Class, Method) subpages will be output showing an overview of the category with summary listings and links to sub categories as appropriate. If you save to XML format data will be output for each of the categories selected.
Performance JHawk is capable of analysing very large numbers of classes. We have tested systems with over 400 packages, 4000 classes and 30000 methods comprising more than 150000 statements. With these very large numbers we have not noticed any problems in relation to analysis provided the CPU and memory are adequate (we are talking here of Intel CPUs in the order of 2.6GHz and 512Mb RAM). We have noticed problems relating to the displaying of the very large lists (e.g. on the 'All classes in System' and 'All methods in system') - these seem to be general Java problems rather than being specific to JHawk. As JHawk uses a very efficient quicksort algorithm which is recursive it is also possible to see StackOverflow errors - the solution to this is to increase the stack size (using the -Xss parameter). The JHawk application run files all use a stack size of 1 Megabyte, a minimum memory size of 64Mb and a maximum memory size of 512Mb i.e. the parameters in the run batch files are all set as - -Xss1m -Xms64m -Xmx512m You may need to adjust these if you are analysing numbers of files greater than those outlined above or you are running a machine with less than 512Mb memory. JHawk will work fine in lower memory environments - but the maximum number of classes that you can deal with will be reduced. Modifying JHAwk JHawk is an extremely useful application as it stands but you can also purchase a license which includes source code and you can then easily modify it to suit your particular needs. If you have purchased a source code license you can find instructions on how to make these modifications in the 'Programmer's Guide'. |

 Any of the results tables in the JHawk can be sorted on any column by double clicking on the column header. To reverse the sort order on the column double click the header again. Depending on the amount of data in the table the sort process may take some time
 At first the list of packages is unsorted but if we double click on it the number of methods is sorted in ascending order.
  Clicking again re-sorts the packages in Descending order.
|
||||